Welcome to Climate Drift - the place where we explain climate solutions and how to find your role in the race to net zero.
If you haven’t subscribed, join here:
Hi there! 👋
Skander here. We continue our series of Climate Drift Fellows diving into different verticals and climate solution areas.
If you want to dive into climate solutions and tackle challenges of climate companies with us, apply to our next cohort here.
Today a long thought experiment on refurbishment and buyback, complete with data analysis and wireframes, from Vianney, a product leader and founder with experience from Google, Spotify to his own companies.
Let’s dive in. 🌊
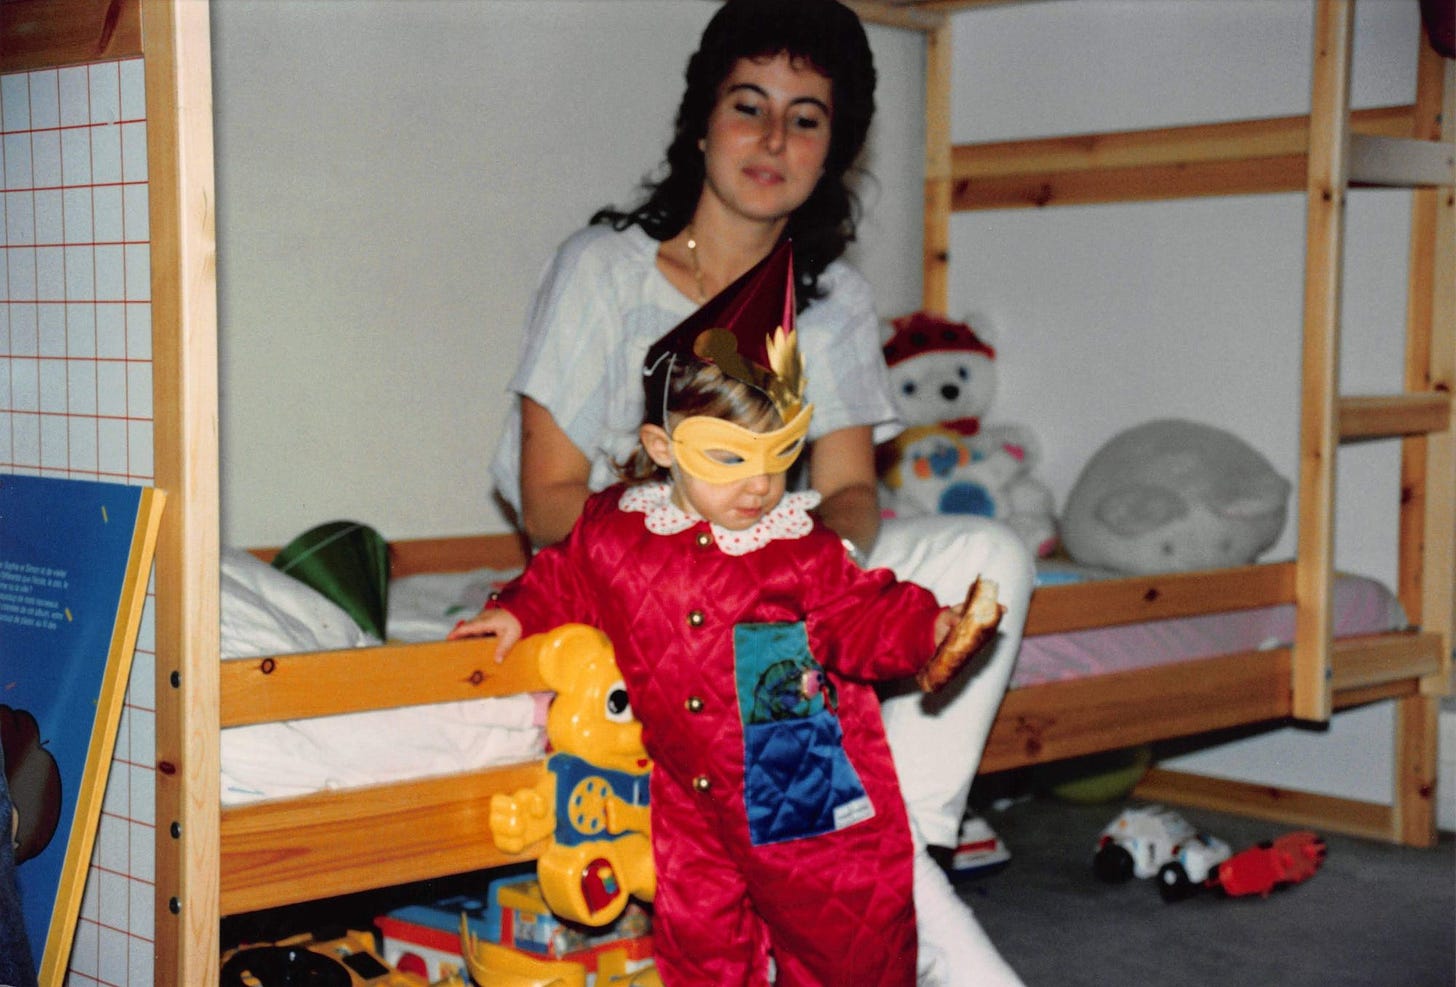
From the dimly lit corners of my childhood room in Paris, where the MYDAL bunk bed stood as a fortress of dreams, to our lego-studded living room in Brooklyn, where my toddler now parkours the PARÜP couch like an adventurous playground, IKEA's furnishings have been an integral, affordable element of my life's backdrop for years.
In February 2024, I had the pleasure of attending a thought-provoking fireside chat with Daniel Haltia, the Global Circular Strategy Leader at IKEA through my participation in Climate Drift, a no-nonsense accelerator I would highly recommend.
This got me thinking about this iconic brand in the context of climate change. Let’s dive in!
📌 In this post, as an “outsider looking in”, I explore:
IKEA’s Carbon Footprint
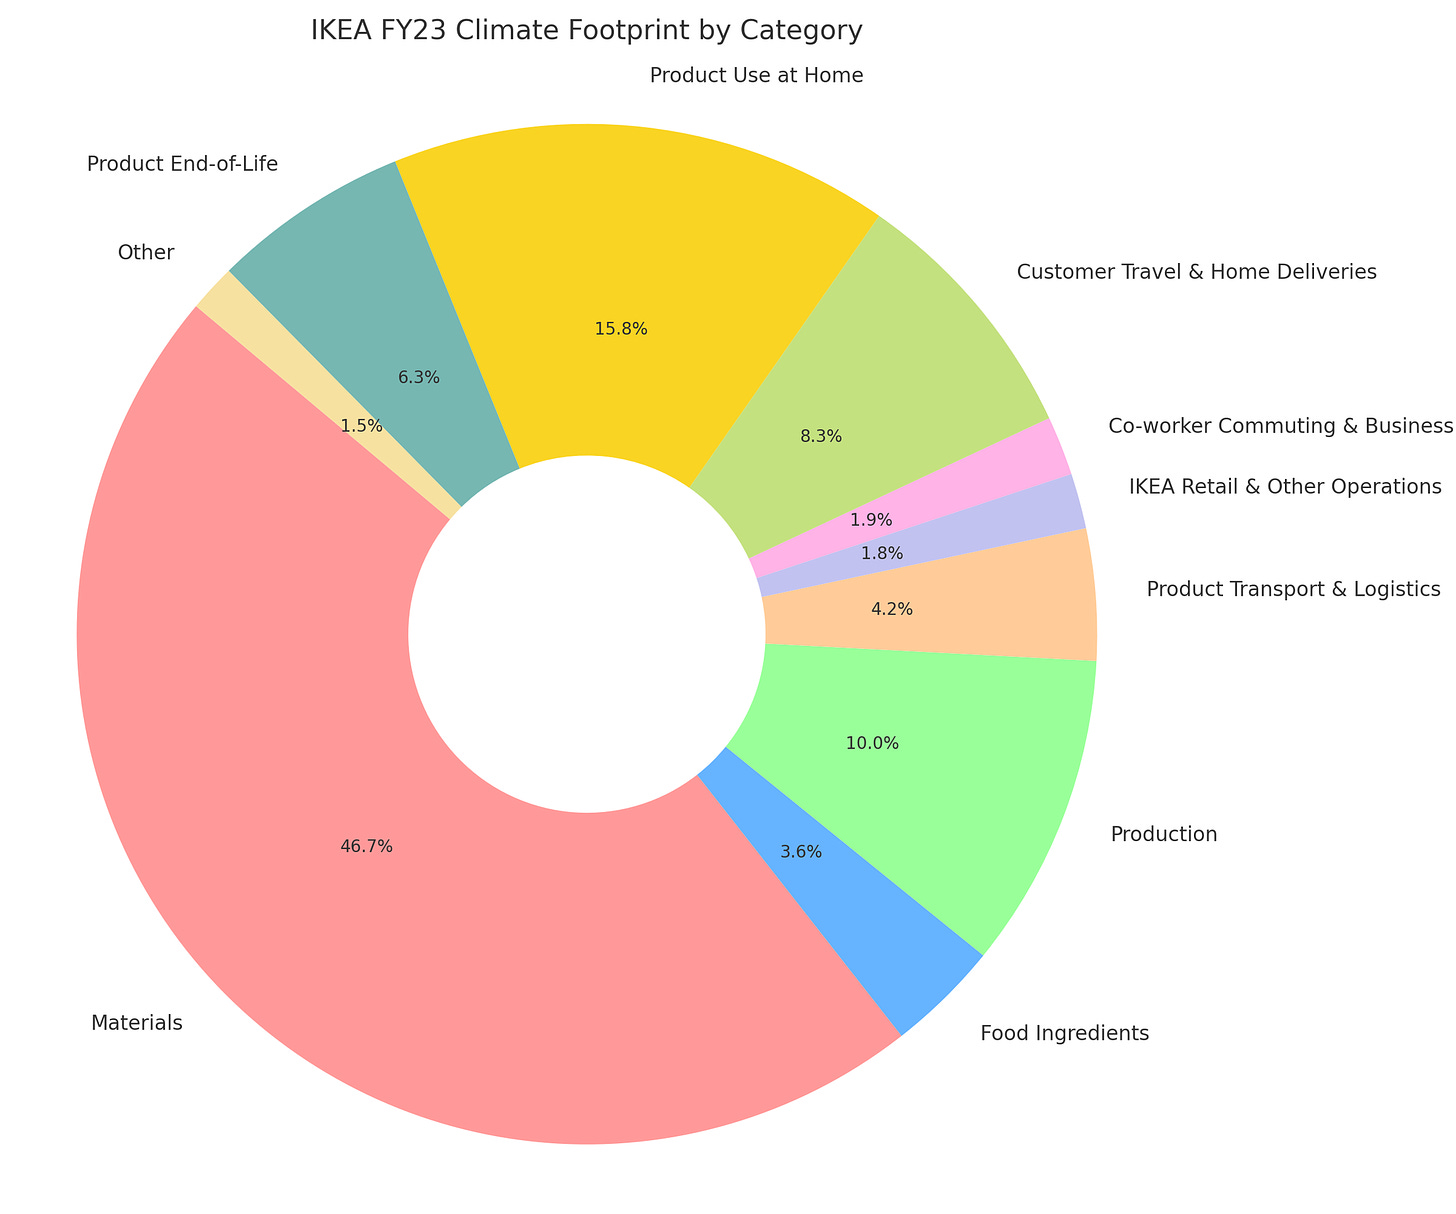
In 2023, IKEA’s emissions were estimated to be 24.1 million tons of CO2e. For context, in 2021, New York City’s and Sweden’s emissions were ~ 52 million and 65 million tons of CO2, respectively. For simplicity and recall, we can think of IKEA as 1/2 of of NYC’s emissions, and 1/3rd of Sweden’s.
Where do these 24 million tons of CO2e come from?
👉 The circularity principles we dive into below could significantly reduce the 3 categories that account for 2/3 of IKEA’s total CO2e emission: Materials (47%), Production (10%), and Product End-of-Life (6%).
IKEA’s Guiding Principles for Embracing Circularity
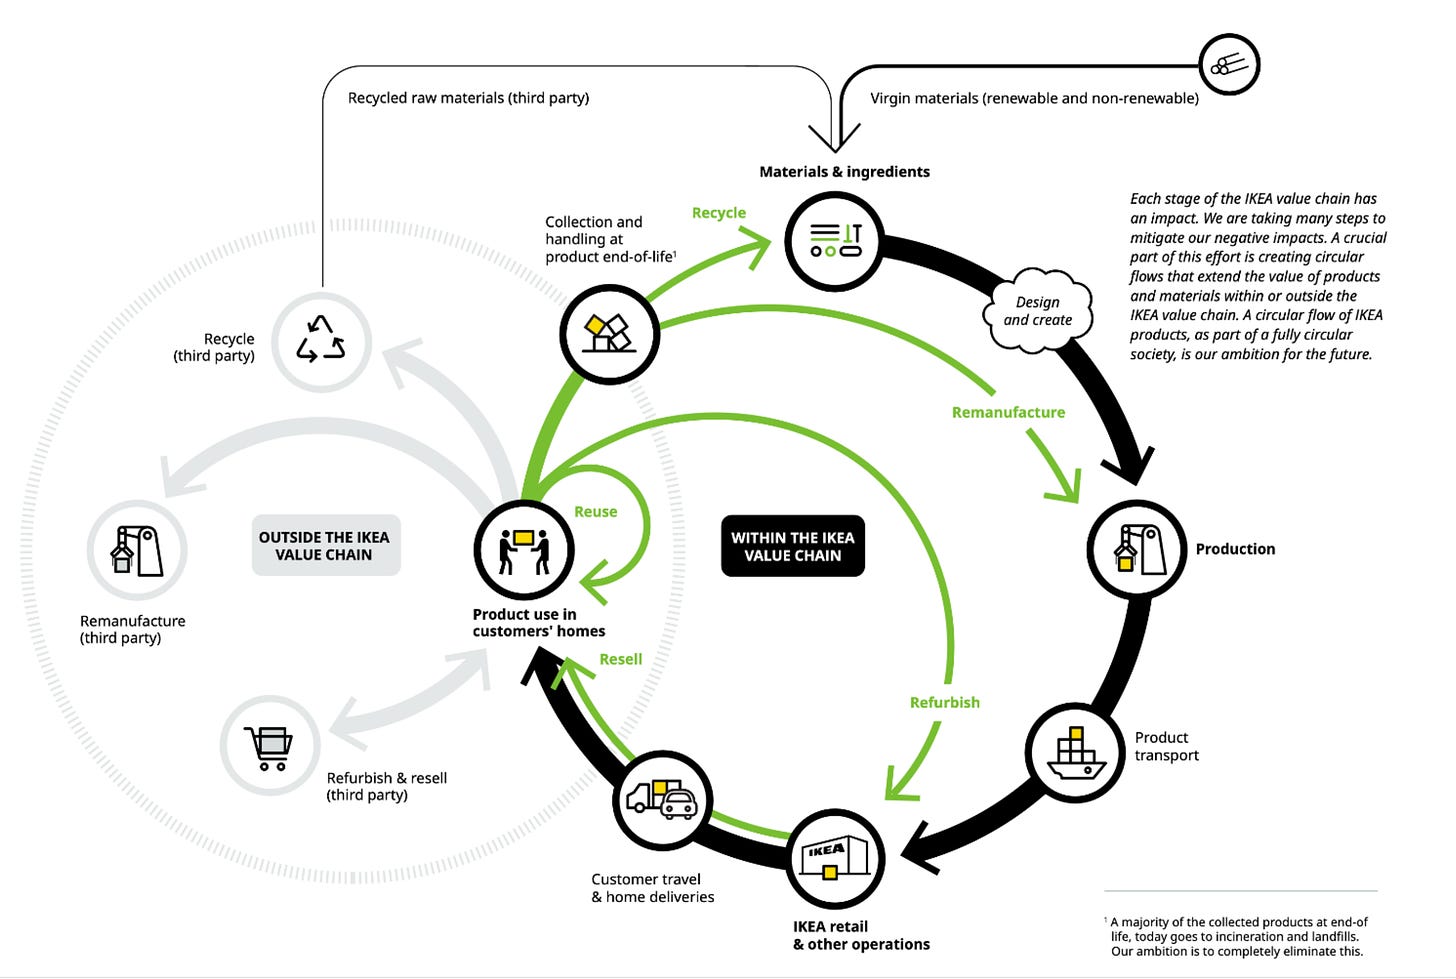
IKEA aims to maximize product and material retention within its value chain, breaking down the process into four key components:
Reuse: Products are continuously utilized by customers, encompassing regular use, maintenance, and adaptation to changing needs. This phase encourages extending product life and supports the secondhand market.
Refurbishment: This involves restoring used, damaged, or outdated products to a 'like-new' condition, often with minor improvements. It can involve customer or professional repairs and upgrades, enhancing the product's value and lifespan before re-entry into the market.
Remanufacturing: This process repurposes usable parts from dismantled products to create new items, optimizing resource use and reducing costs for IKEA.
Recycling: At the end of a product's lifecycle, recycling converts products into new raw materials for use within IKEA or elsewhere. This step is considered after exploring all options for reuse, refurbishment, and remanufacturing.
👉 My focus is on optimizing the Refurbishment and Remanufacturing parts of the cycle
Fungibility and Demand-Driven Refurbishment
📌 Thought experiment in a nutshell: given the highly fungible nature of IKEA furniture, IKEA can economically buy-back furniture and refurbish according to current demand.
When a company implements a buy-back program, there is always the risk of lower-than-expected demand for refurbished older models, lower turnover rates, an increase in inventory carrying costs, and ultimately dealing with the sunk cost of dead stock.
IKEA is in a great position to minimize these risks, and operate a best-in-class buyback program.
As we will see below, each IKEA product has a median of 5 close substitutes. This makes the matchmaking between current customer demand and the supply of bought-back products significantly more efficient; instead of a 1:1 match between customer demand and refurbished product, the bought-back product can be demand-driven, and “refurbished to order”. Given IKEA’s high volume of sales, data on existing and near-term demand for products should be high-signal. In other words, IKEA’s refurbishment program has the potential to be significantly de-risked compared to the industry average, and with relatively better margins.
To drive the point home with a simple example:
IKEA buys back a white desk, with drawers on one side.
IKEA re-purchased this item fully knowing that demand over-indexes for a close substitute (black desk with two sets of drawers).
IKEA refurbishes white desk to become black with two drawers.
Refurbished product sold online immediately after it became available, no inventory costs.
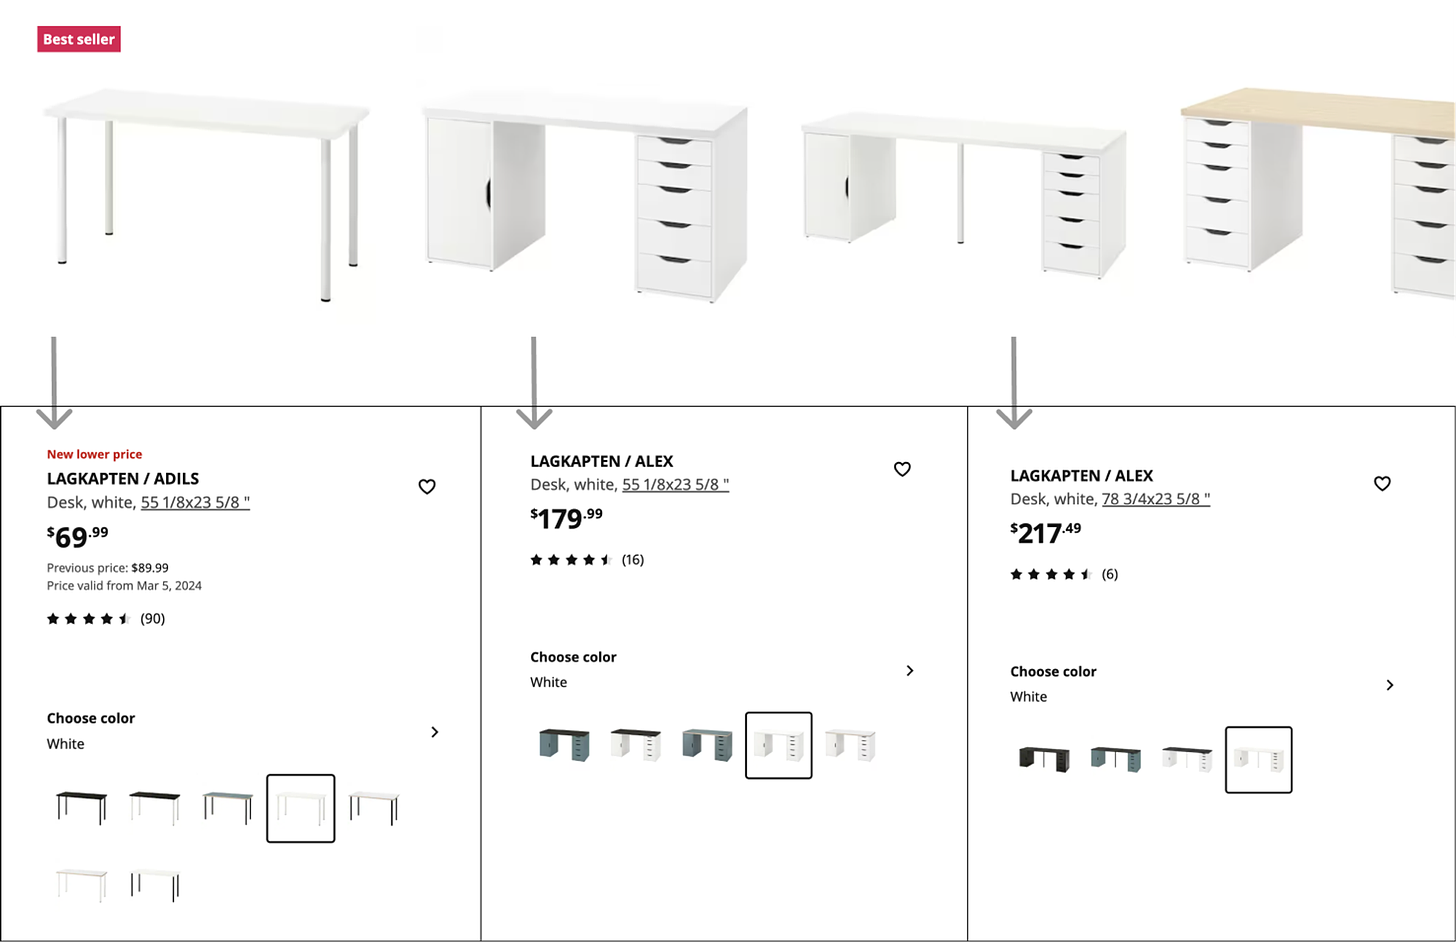
The concept of “fungibility” came to mind when looking at IKEA search results, where a highly fungible good is defined as highly replaceable by another identical item.
To make this more concrete, let’s consider IKEA’s LAGKAPTEN line. We can think of fungibility across two axis: standardized components shared within a product line; and variations in color and finish for the same product.
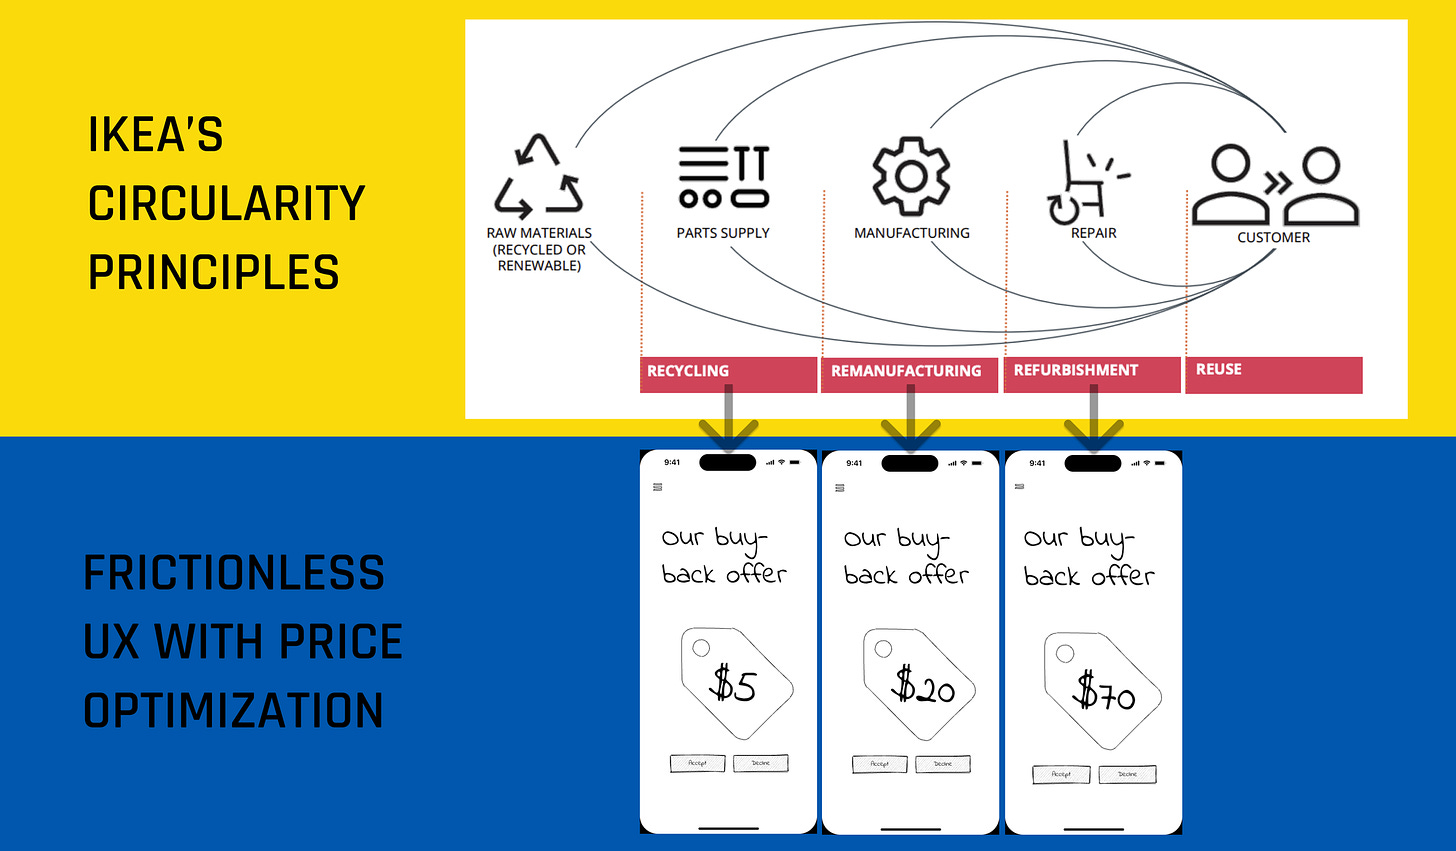
Let’s translate IKEA’s circularity principles into a simple flow-chart that highlights the relationship between refurbishment and product fungibility.
On average, buyback price $A > $B > $C > $D > $E. The higher up the value chain (e.g. furniture versus raw materials), the higher the buy-back price offer can be, and the greater the chance of a buy-back transaction (another assumption is the buy-back price bakes in an economically viable margin for IKEA). Refurbishing a bought-back product and modifying it slightly to meet new demand is likely to cost more ($B < $A), but the probability of selling is much higher, and warehouse/inventory costs are lower.
The underling business logic in the above diagram is based on two other assumptions:
Product fungibility: to what extent does IKEA inventory of products exhibit the potential for “fungibility” or substitution? And, from a material science perspective, which products can be refurbished vs need to be recycled, etc.
Dynamic pricing based on automated condition assessment and predictive analytics: can consumers get a quote for their used product within a few minutes?
Let’s examine the first assumption: my goal was to gain a comprehensive, data-informed understanding of how standardized and interchangeable IKEA’s extensive product range is. To achieve this, I leveraged the IKEA api client built by Lev Vereshchagin and wrote a script1.
In breaking down their product offerings, we find that ~85% have one or more “direct substitutes” (a different color or finish, or other minor variation).
Out of the 9,500+ products available via the IKEA api client, an IKEA product has a median of 5 substitutes and an average of ~3.7.
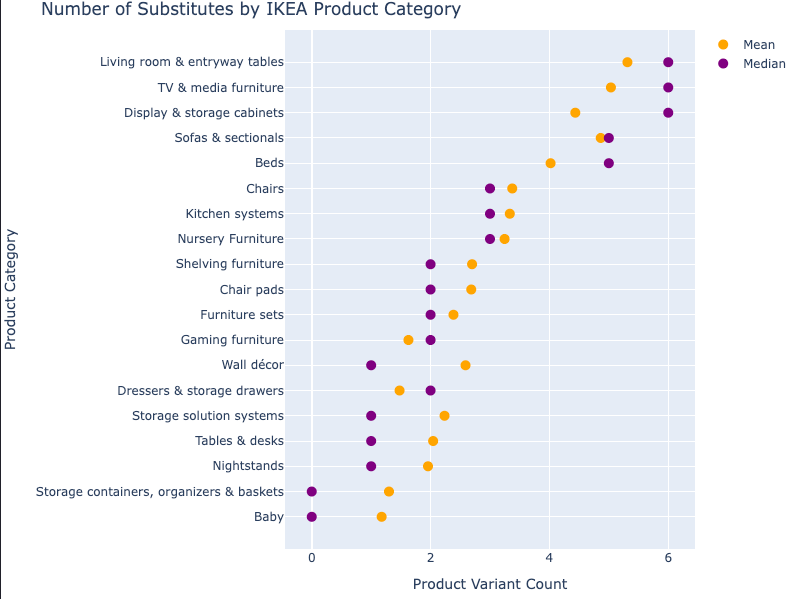
Going one step further, we can create a treemap of all IKEA products (by their global product IDs), where the size of each rectangle is the current stock volume, and the color gradient is based on how many substitutes each product has. The greener the color, the more substitutes.
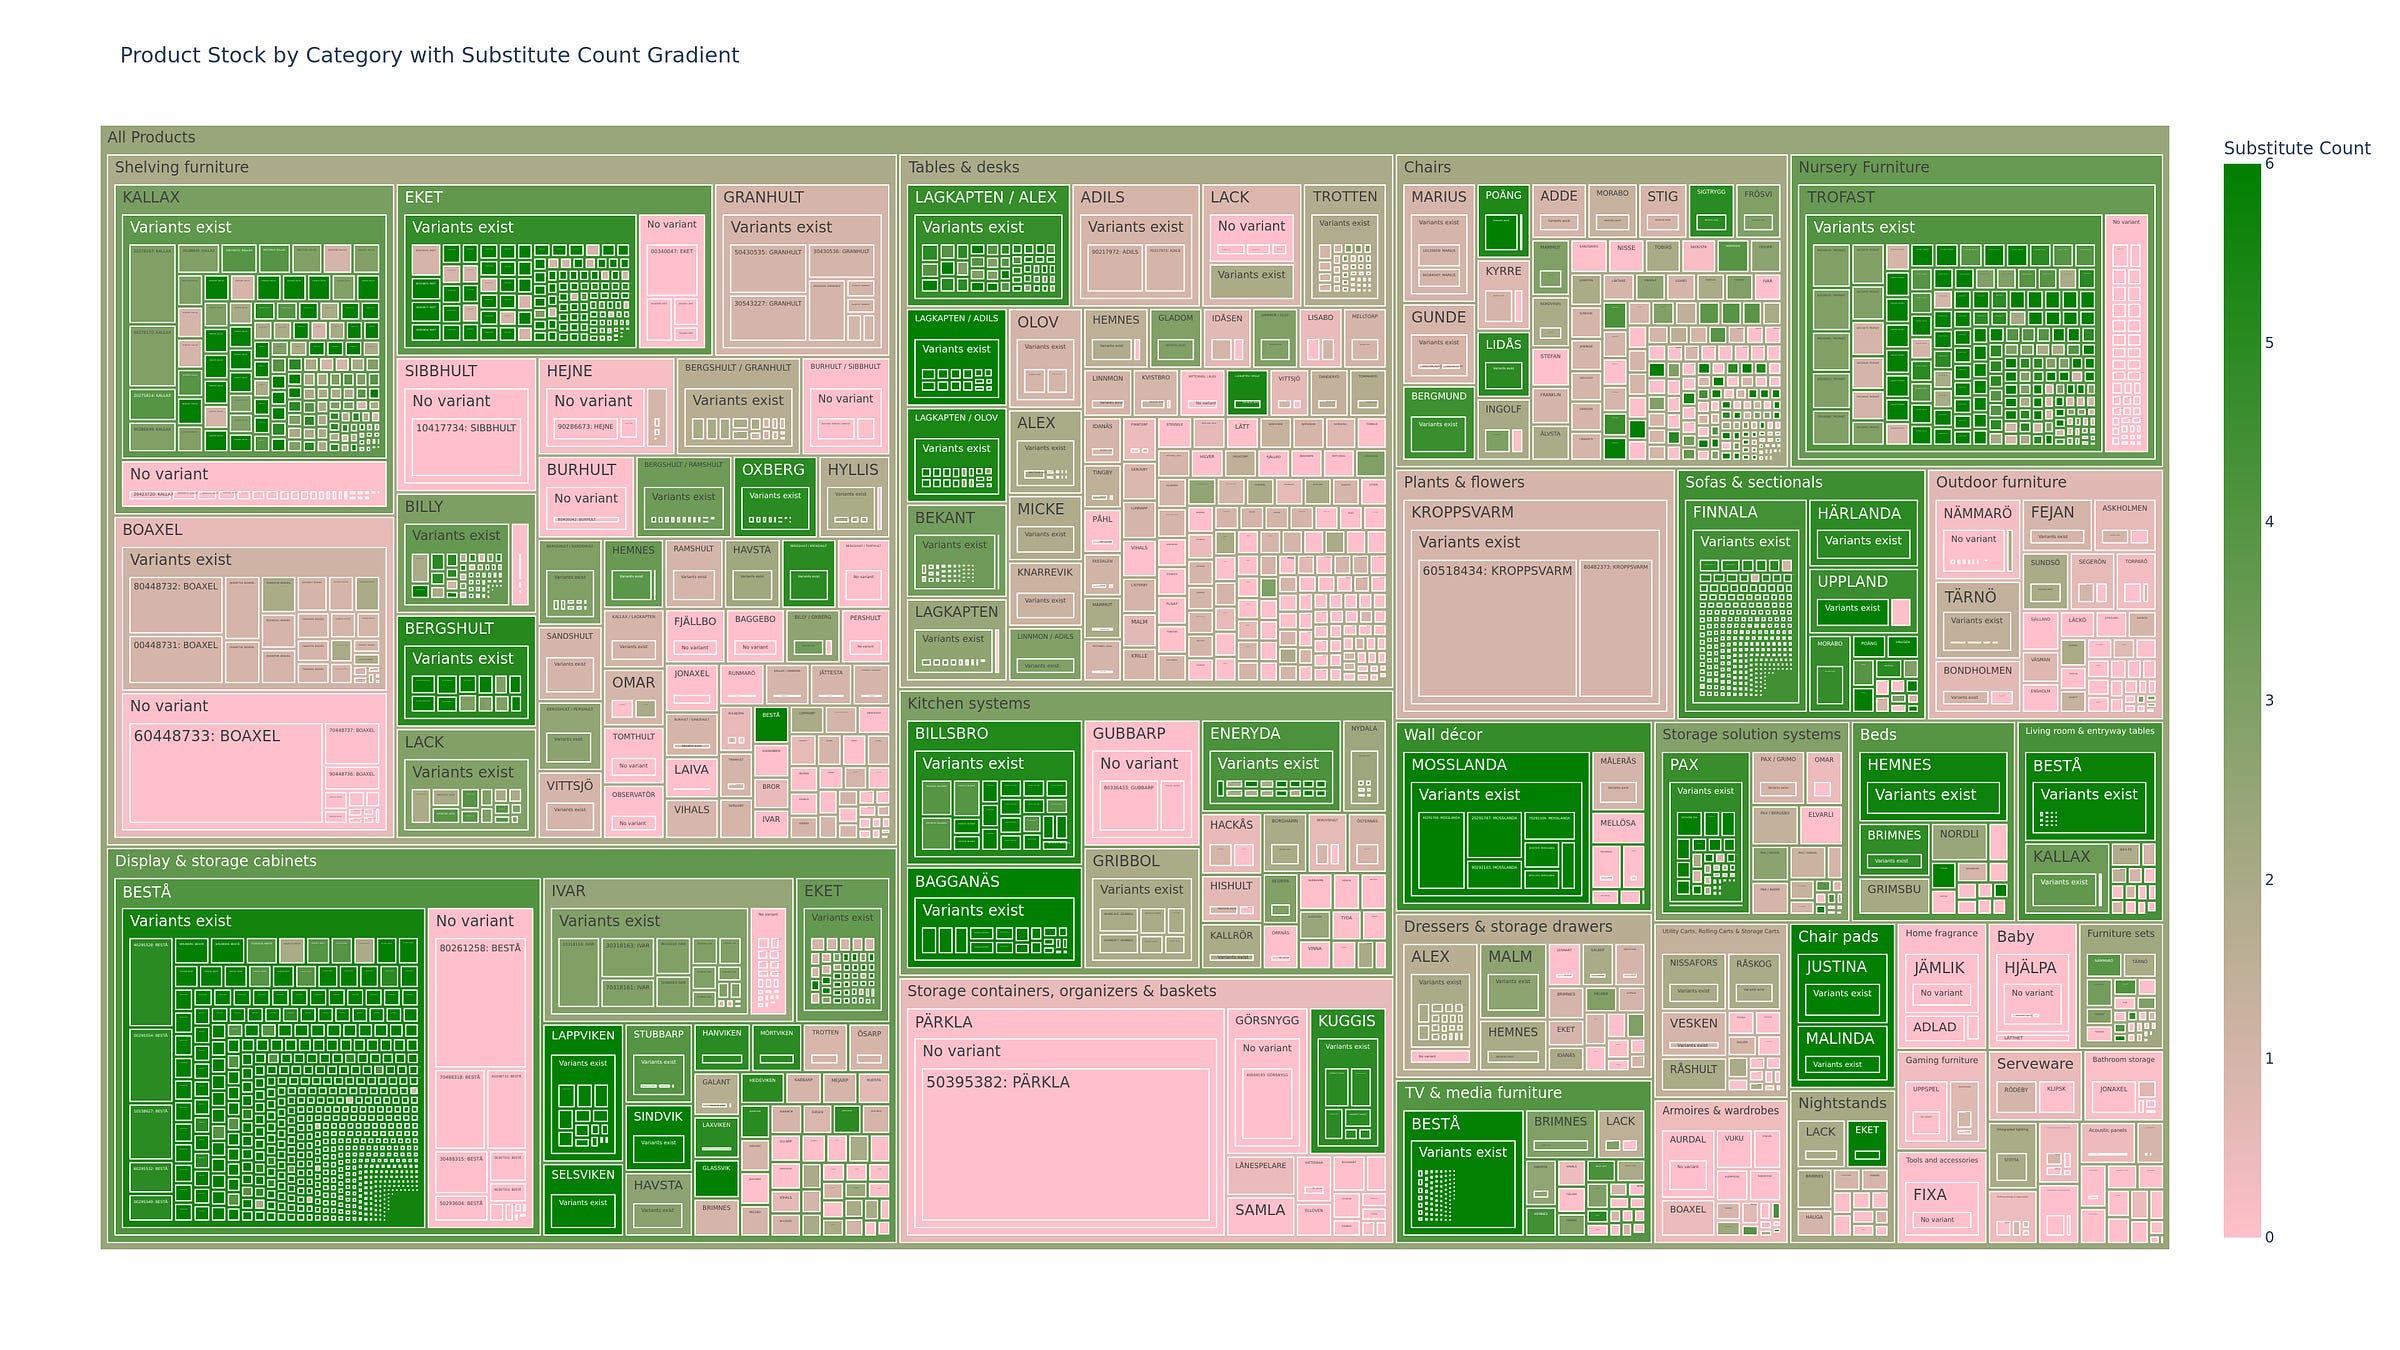
As can be seen, some product lines lend themselves especially well to the idea of “fungibility”, and could be strategic testing grounds for two of IKEA’s circular loops (refurbishment, remanufacturing). Proving out some of these loops with the Display & storage cabinets category would provide both significant volume and many product variants to work with.
As for the second assumption, how might dynamic pricing and “instantaneously” providing the consumer with a buyback quote work? High level, a non-exhaustive list:
Automated product condition assessment
In what condition is the consumer’s used product? In which circular flow does it belong (Refurbishment, Re-manufacturing, etc)?
Computer vision and AI have been successfully deployed in a number of industries to assess the quality and authenticity of products. These include eBay, Amazon, and companies such as Ravin.ai in the auto industry.
While there is unlikely an off-the-shelf solution for IKEA’s large portfolio of products, investing in this technology is the only plausible path to embedding true circularity within IKEA’s business operations. Simply put: if conducting a buyback transaction online takes more time than moving the used product to the curb, these programs will never achieve critical mass.
Product fungibility and cost data
Can buyback candidate A be refurbished into products B and C? At what cost? If not, can A be ingested in a remanufacturing flow? etc.
Basically: all of the data and algorithms that underpin the Ikea Circularity Flow chart above.
Product demand forecasting data
For buyback candidate A: what is demand today and in X days — when the buyback candidate would be refurbished and on the market? Similarly, what is this data for substitutes B & C?
Goal: if feasible and cost-effective, should product A be refurbished as A, B, or C?
Unit Economics: data and business logic
Operationally, what are the total costs from from buyback to new purchase for a buyback candidate?
What margins is IKEA willing to accept in order to increase the circularity of their value chain? Does this differ by circularity loop (refurbishment vs. remanufacturing)?
IKEA Buyback program: Flaws & Future
Let’s turn to the user experience of participating in IKEA’s buyback program.
IKEA's Circular Product Design Guide effectively captures the five main aspects customers take into consideration in their relationship with physical goods:
Value – customers are looking to have less things. Instead they want the things they choose to be as good as possible, and therefore more valuable.
Affordability – is not just about the thin wallets. No one wants to sacrifice function, quality, design, or sustainability for low price, and sometimes customers prioritize spending their money on other things.
Wastefulness – our customers do not want to be wasteful, and feel bad about throwing things away.
Convenience – as one of the biggest hindrances to acquiring, caring for, and passing on products, convenience is the driving force behind customer behavior.
Citizenship – people want to be good citizens of the planet and contribute to the betterment of society and environment. There is a growing consciousness about consumption, and a wish to be more sustainable.” - page 3.
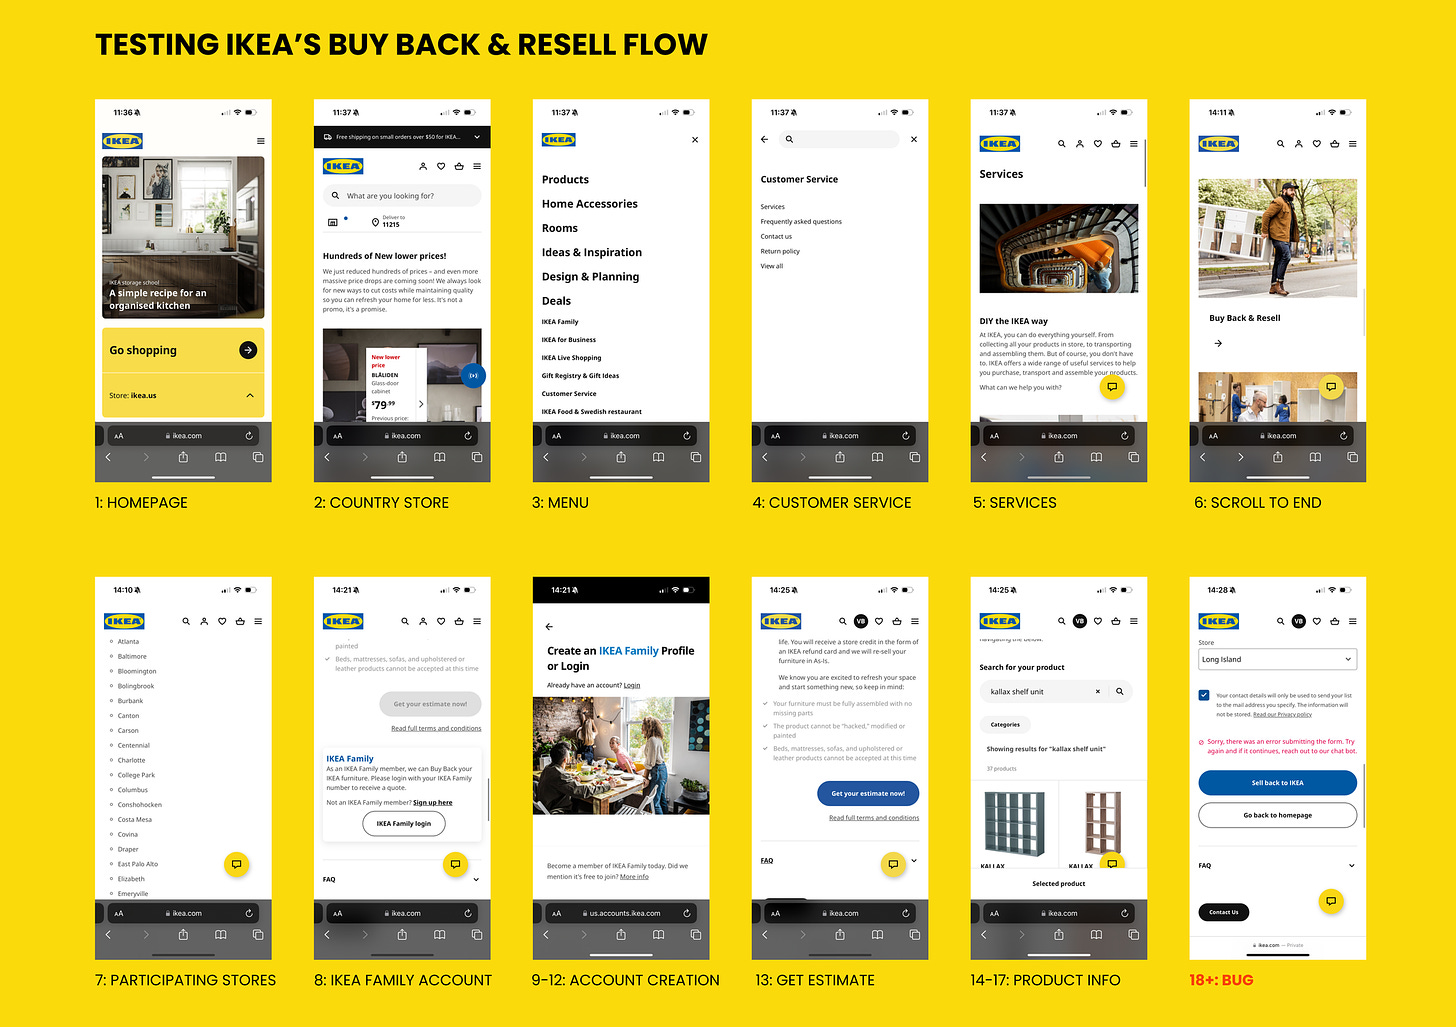
Unfortunately, when it comes to applying these principles in practice, IKEA’s buyback falls short, especially when it comes to convenience:
Lack of discoverability: the buy-back program takes navigating through six pages and scrolling all the way down a long list of customer service programs to find. I ended up googling “ikea buyback program” and then reverse-engineering the UX flow. In other words, only customers with very high intent will ever find this program, and for the very few that do, they are unlikely to succeed in going through the actual flow.
Lengthy, convoluted UX flow: in total, it takes navigating through ~ 18 pages to participate in the buy-back program. Many pages are counter-intuitive and require a fair amount of cognitive load (the list of participating stores are not hyperlinked, the “Get your estimate now” button is disabled until you realize that you need to create an Ikea “family account”, etc).
Inconclusive due to a bug: after 18 steps, a bug appeared, and I was told to reach out to a chatbot.
👉 High level, I’m guessing that < 1% of IKEA customers use their buyback program in the US. Only the most fervent climate-conscious consumers are likely to sell back to IKEA; those who are simply trying to recoup some money are likely to opt for other secondary markets like Craigslist, AptDeco, etc.
As an IKEA customer in the US, here is a glimpse into the buy-back program experience:
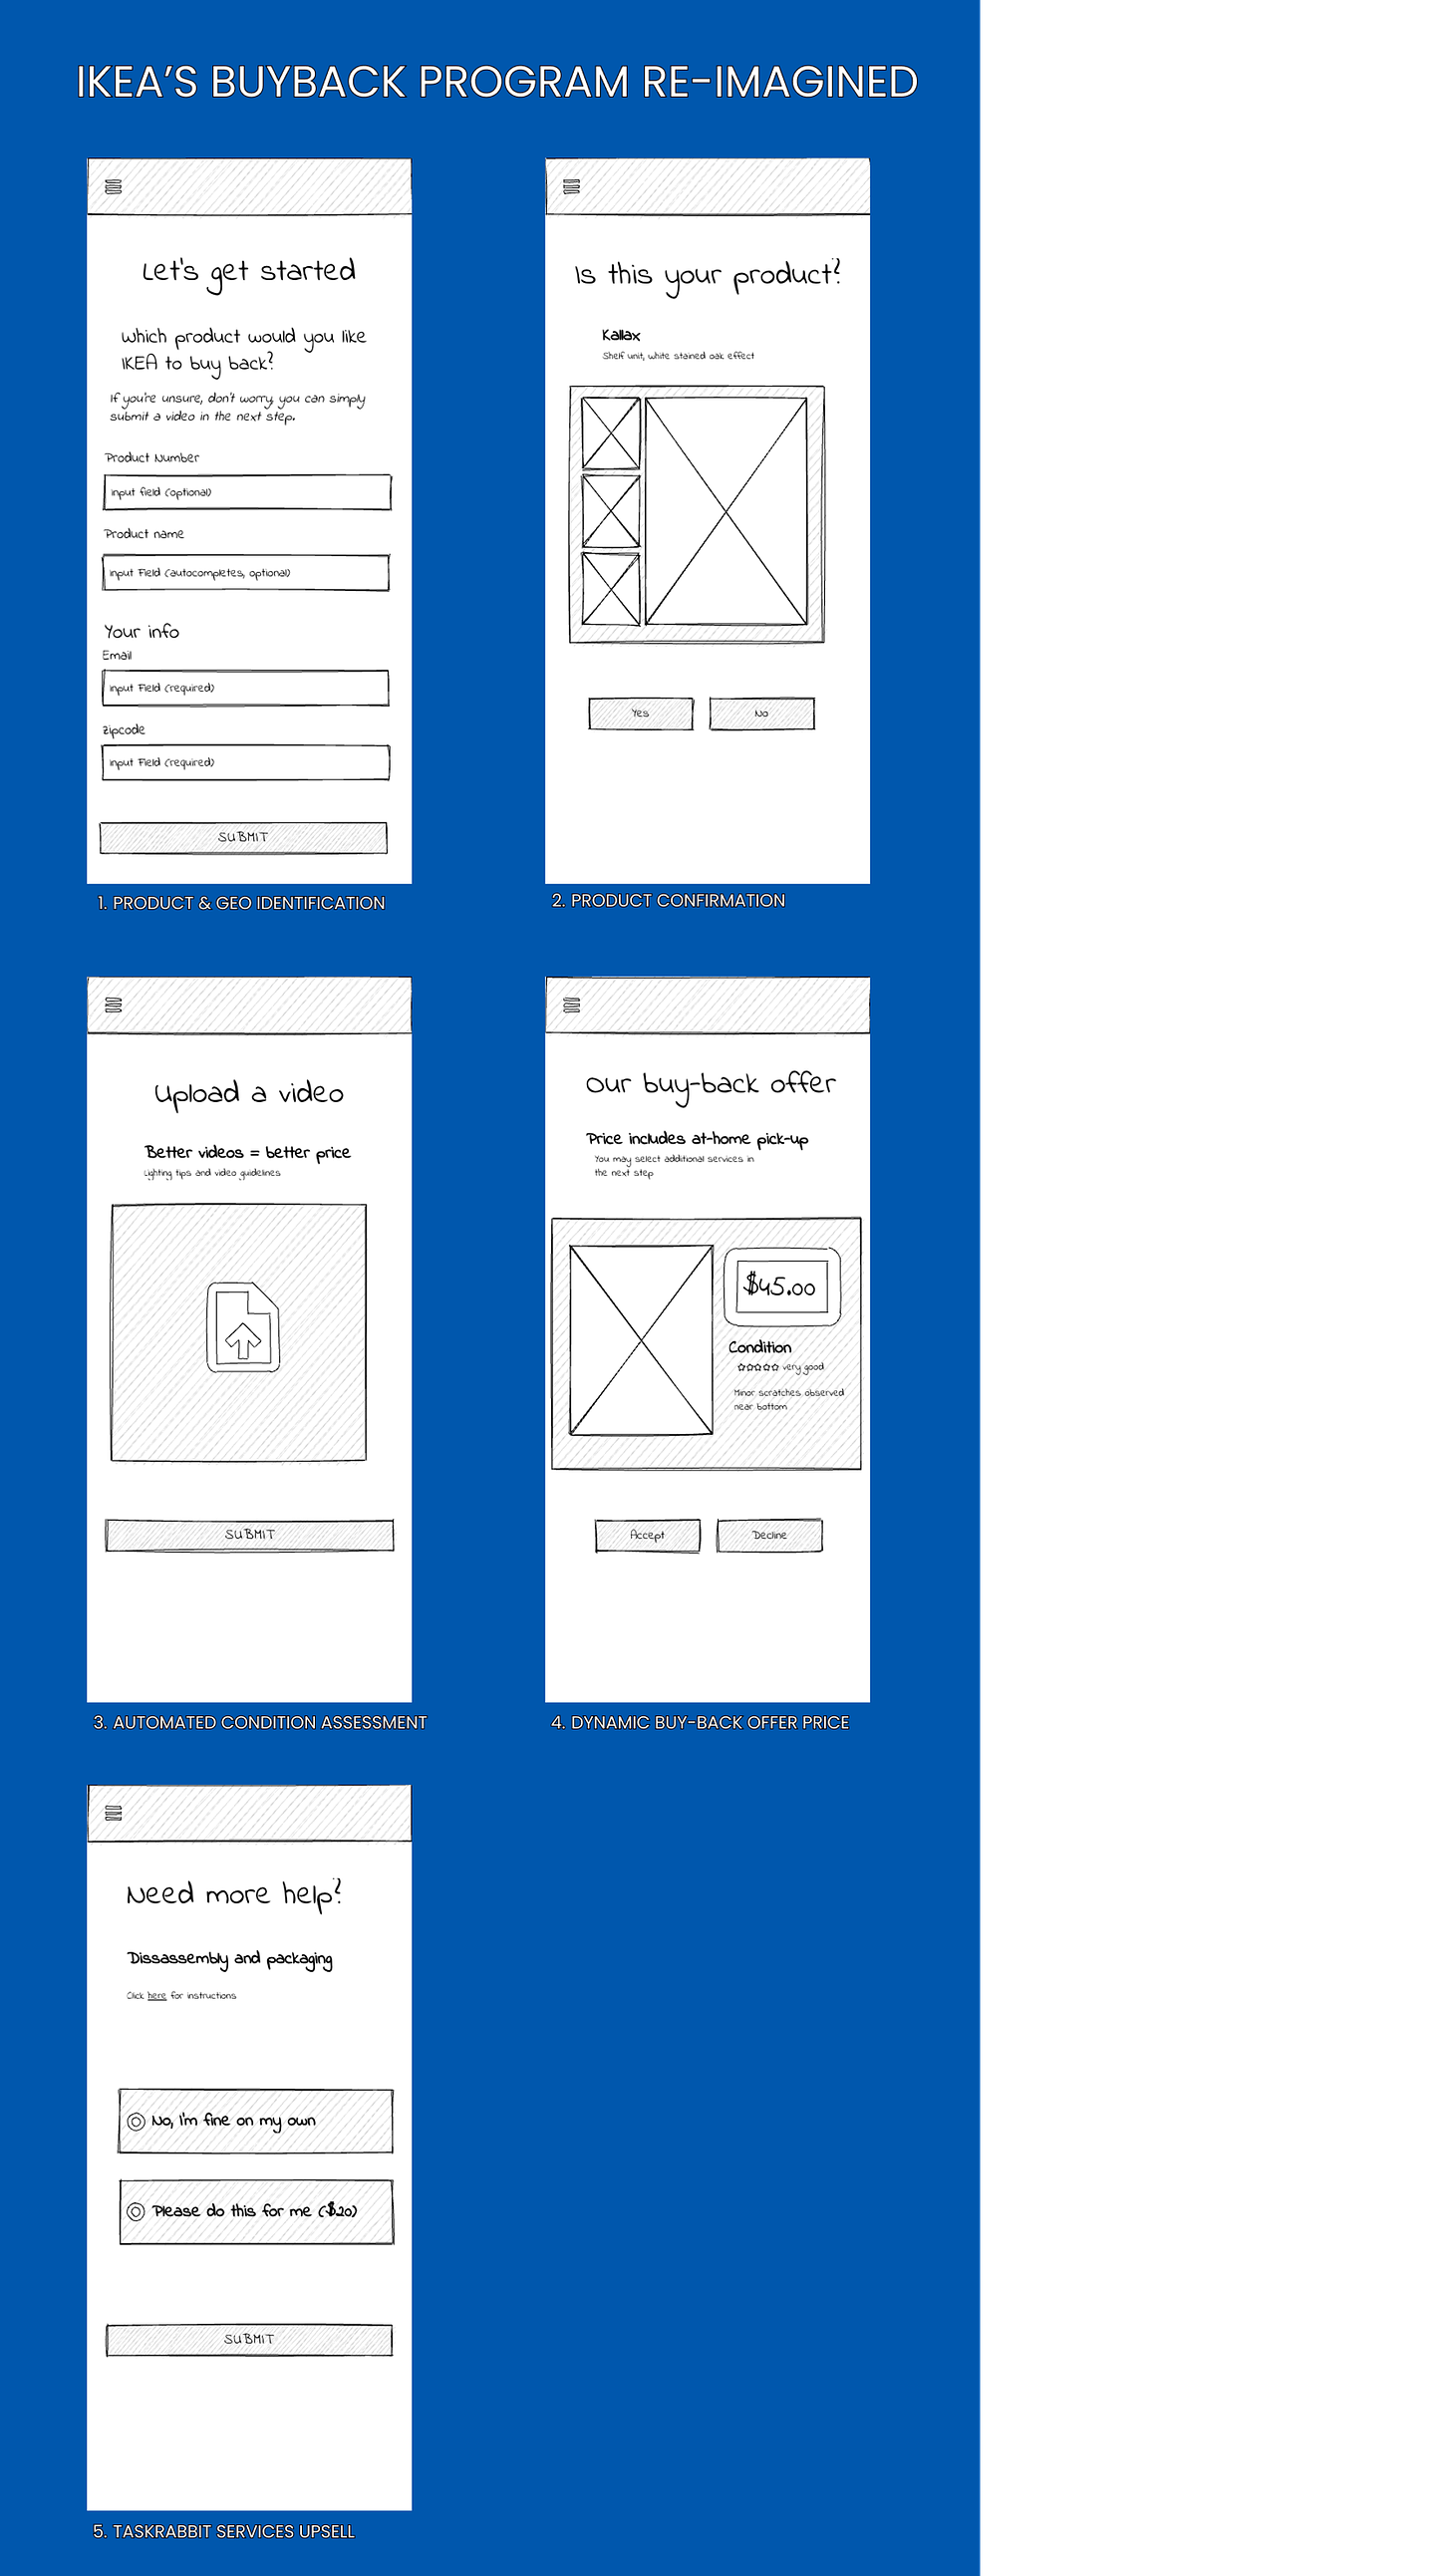
A modern buy-back program should take 5 minutes online
👉 IKEA should take a page from other marketplaces that leverage AI and computer vision for product identification and automatic condition assessment.
IKEA’s acquisition of TaskRabbit also gives them a strategic edge in creating a best-in-class user experience for their buy-back program.
Here’s a very simplistic version of what IKEA’s buyback program could look like. As mentioned above, the main magic under the hood is the computer vision to assess product quality and the data-science that generates a buy-back price instantaneously.
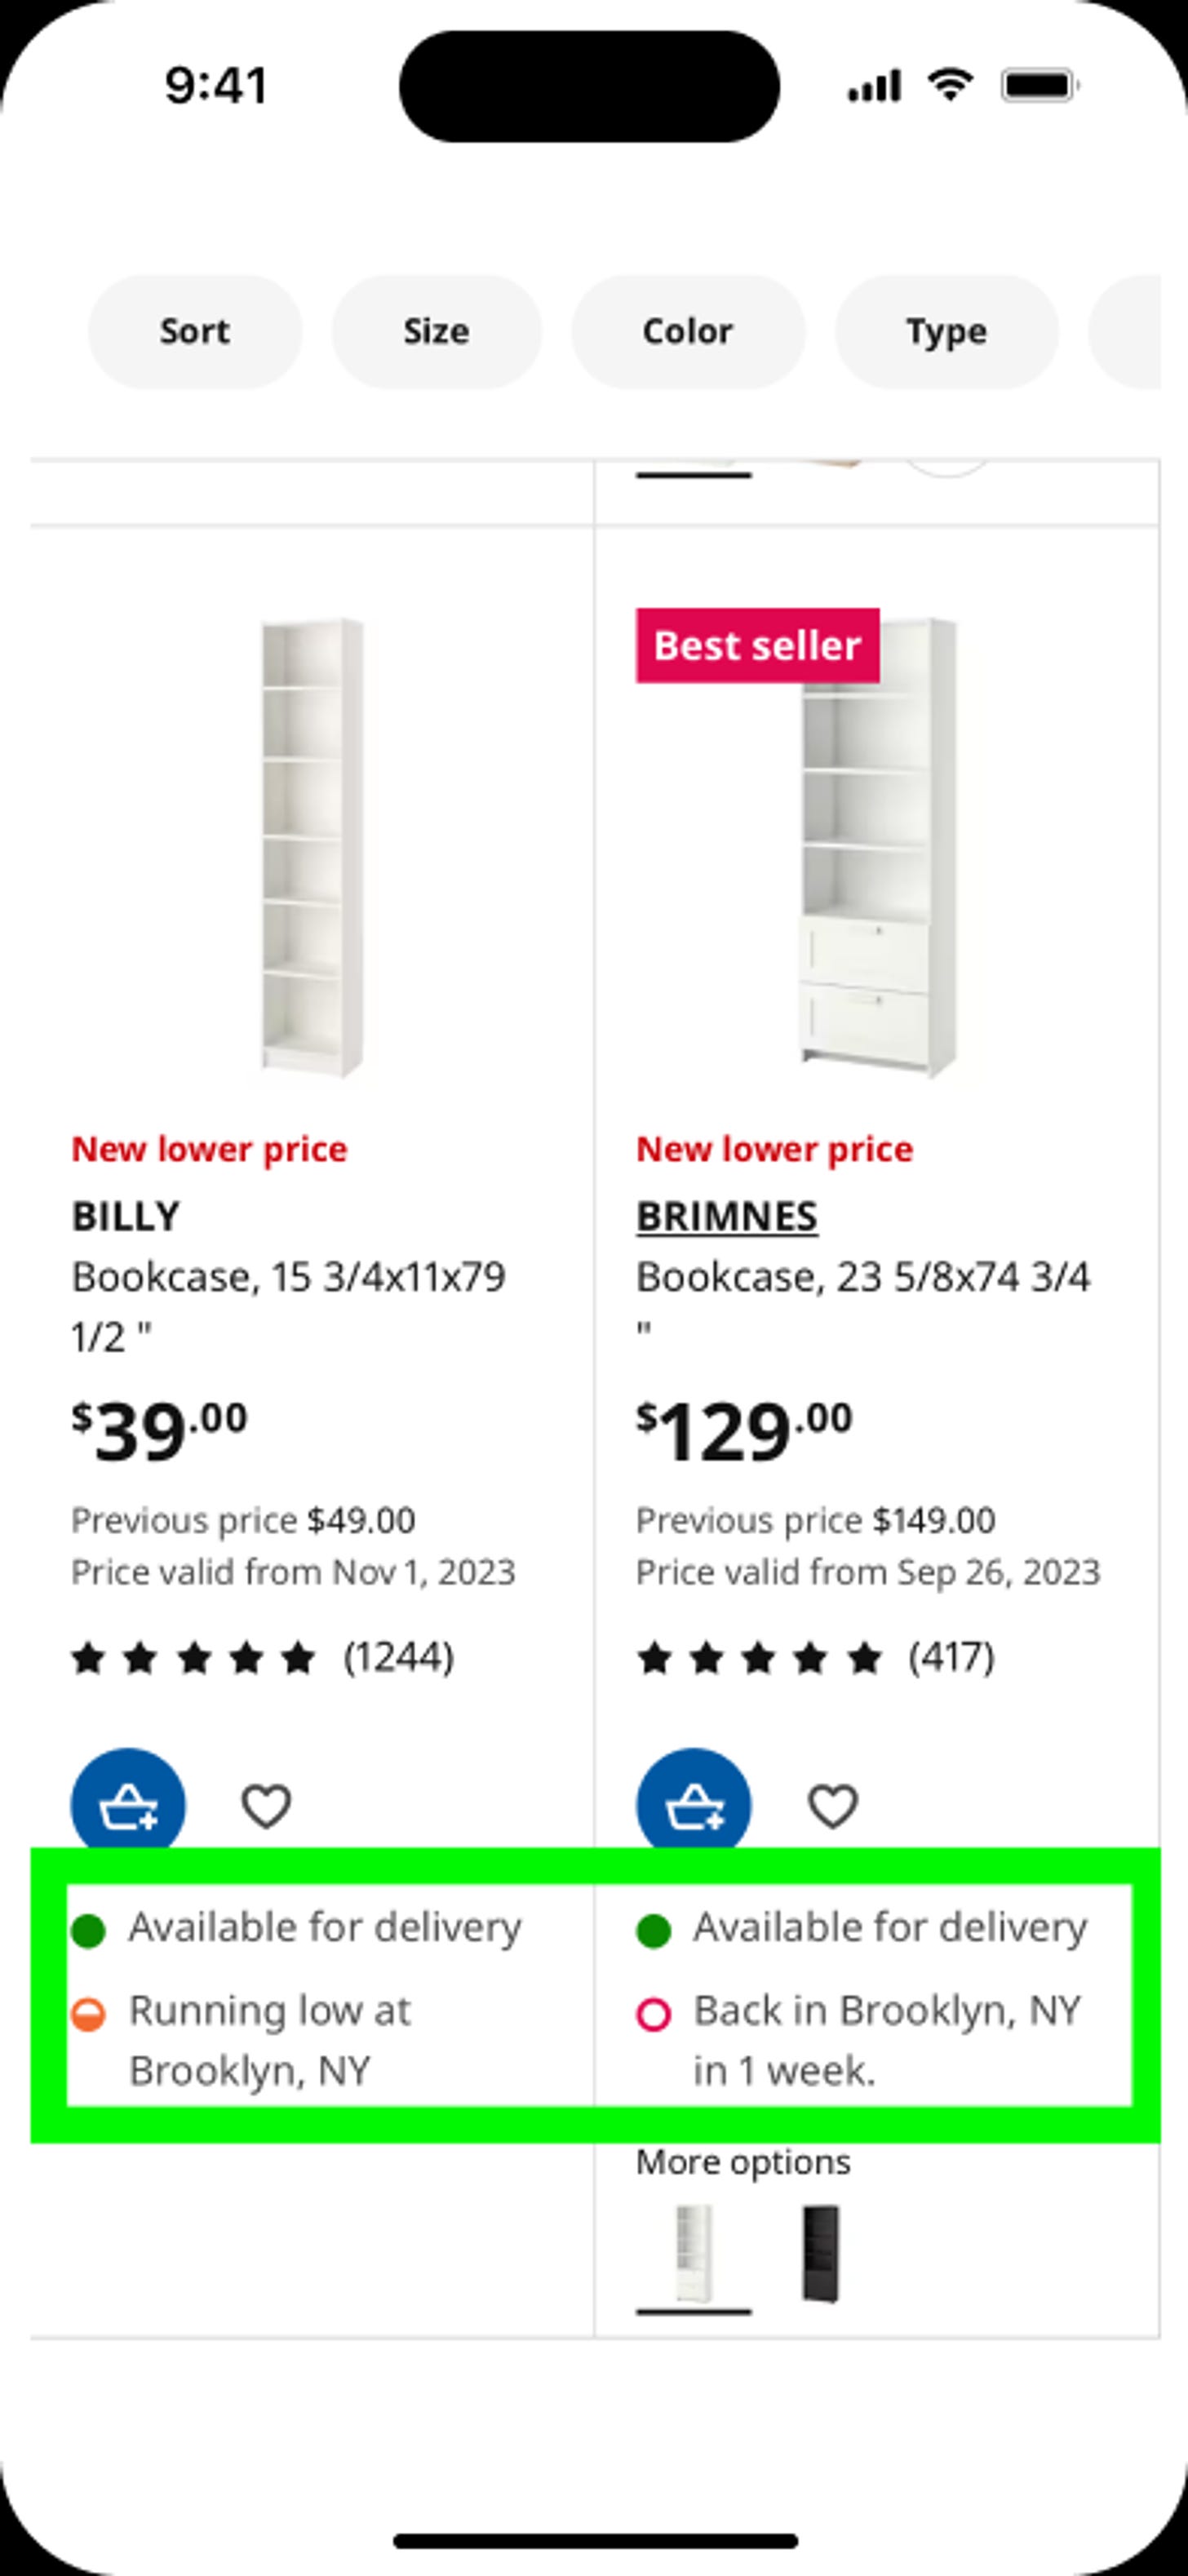
Integrating refurbished products within the core search experience
Many shoppers don't fundamentally object to acquiring pre-owned or refurbished items, nor are they strictly committed to buying new. But the increased hassle involved in purchasing used often leads to new products being the default.
One simple suggestion would be to include a 3rd icon under each product listing in the search results signaling the availability of refurbished IKEA products. This would likely 10x (or more) the amount of demand for refurbished or as-is inventory.
This would have positive knock-on effects for IKEA’s buy-back program; buyers today are sellers in the future, and this would drive significant awareness.
Also: many IKEA customers are repeat-buyers; and buying new furniture often means you are disposing of/selling older furniture at that very moment. Embedding refurbished items within search results is just one helpful first step in establishing clear circular thinking in the consumer’s mind.
The Takeaway
Product standardization is clearly a core part of IKEA’s strategy in providing consumers with a vast array of choices while keeping production (and consumer) costs highly competitive and affordable. Standardization is also explicitly mentioned within IKEA’s forward thinking “Circular Product Design Principles”.
IKEA has powerful ideas around circularity but they are largely absent in the consumer experience, and are not yet making a material dent in IKEA’s global CO2e emissions.
From this exploration, I would recommend that IKEA:
Capitalize on its uniquely vast and modular product lines and invest in demand-driven refurbishment.
Allocate more resources towards data and materials science to ensure refurbishment processes can quickly adapt to present and upcoming market needs.
Prioritize the development of automated systems for assessing product conditions, a key factor for enhancing the buyback experience.
Commit to better UX for the buy-back program: it should take no more than 5 minutes.
Sell refurbished products alongside its new products. It’s the only way circularity will make it into the mainstream.
Topics I would love to dive further into
The material science behind IKEA products. What fraction of IKEA’s products are truly capable of being refurbished vs. remanufactured vs. recycled?
Unit economics of refurbishing and remanufacturing in the IKEA context. IKEA API provides pricing, so it could be relatively easy to come up with a few credible models.
Consistency of product design over time: How much does IKEA consider current inventory as modular components for future items? As consumer tastes change over time, does IKEA deliberately incorporate the design of today’s products into the design roadmap of future offerings?


