Welcome to Climate Drift - the place where we dive into climate solutions and help you find your role in the race to net zero.
If you haven’t subscribed, join here:
Hey there 👋,
It's Skander here.
Ever puzzled over how solar soared or why hydrogen is struggling to find its footing? Why do some climate technologies flourish while others falter? The answer lies in a complex journey through various stages of growth, adoption, and sometimes, stagnation.
Join me as we delve into the S-Curve of Technology Adoption, a concept that's now at the heart of Climate Tech. Let’s explore the highs and lows, the breakthroughs and setbacks, and the dance between innovation and constraint that shapes our path towards a cleaner future.
Time to dive in. 🌊
🚀 If you want to make a difference and bring your talent into climate:
Apply to our next cohort and join the Climate Drift Accelerator.
Interviews and admissions are happening right now.
The S-Curve Chronicle
Stages of the S-Curve
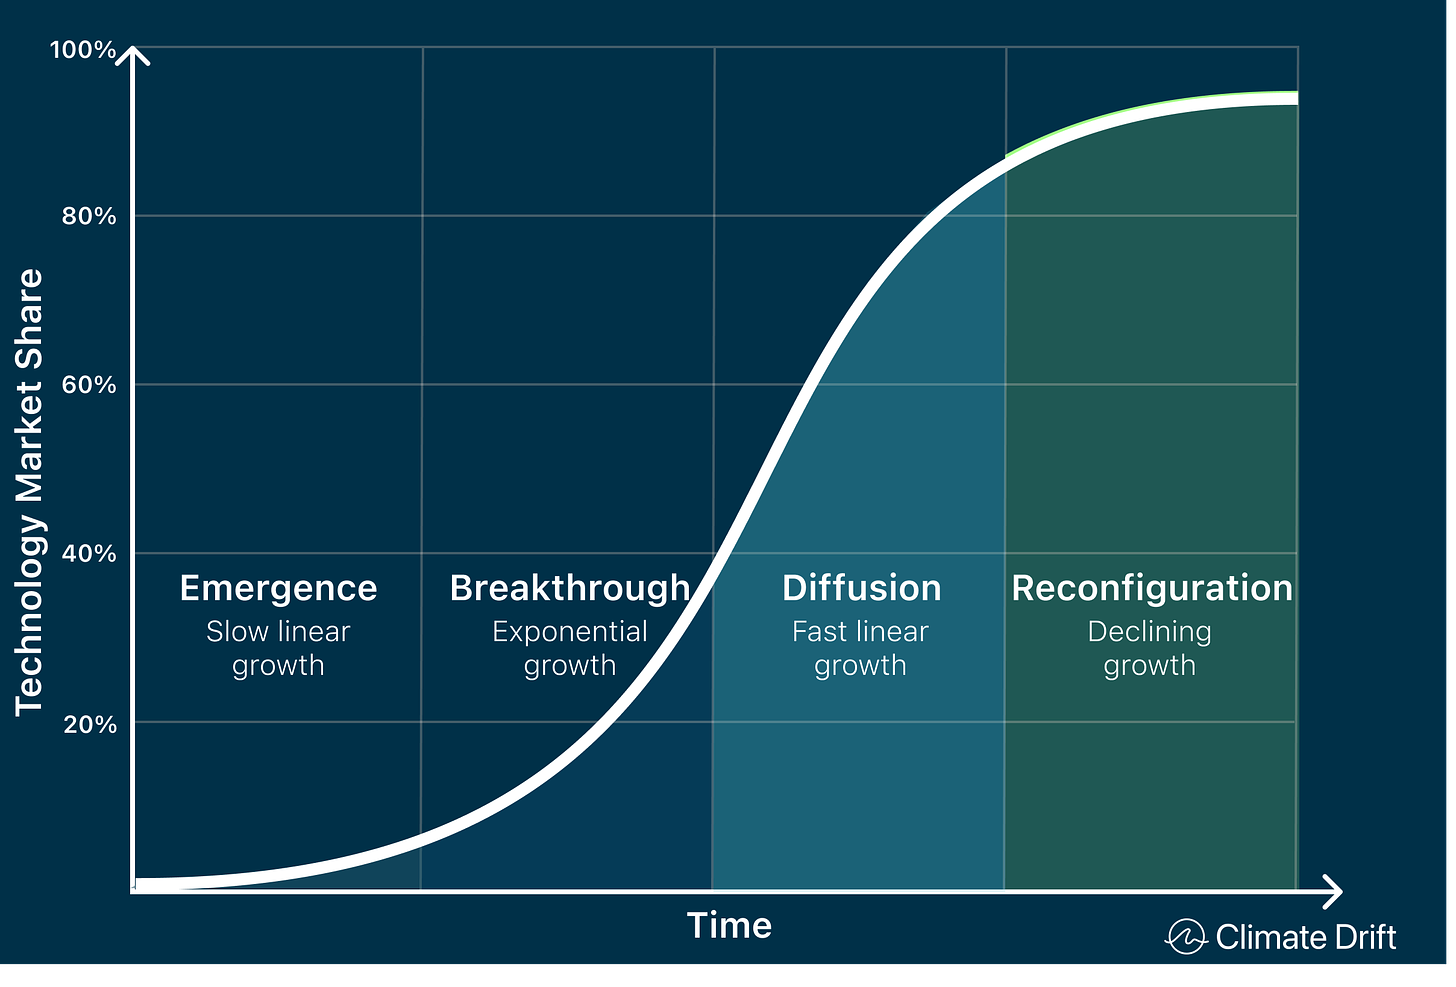
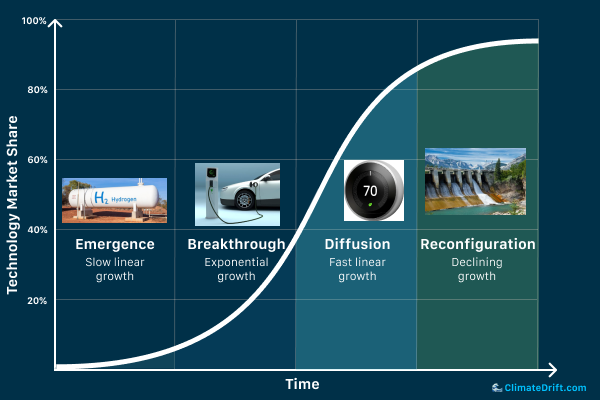
The adoption of new technologies rarely follows a straight line. More often, it traces a complex S-curve trajectory, shaped by various stages of growth and development.
Emergence Stage: Initially, progress is slow and linear, like a budding idea trying to find its footing, often hindered by technological constraints and market uncertainties.
Breakthrough Acceleration: Then, a critical breakthrough occurs, igniting exponential growth. This forms the steep incline of the S-curve, driven by innovation, acceptance, and market dynamics.
Diffusion and Integration: At this stage, the technology becomes mainstream, growing linearly but at a much faster rate. It weaves into daily life, becoming a standard part of the landscape.
Reconfiguration: Finally, as saturation looms, growth starts to taper, reflecting the maturation of the technology.
This S-curve isn't set in stone. It can be twisted and turned by obstacles, or given a boost by supportive policies, leading to positive tipping points. A mere linear assessment won't do justice to these complex dynamics.
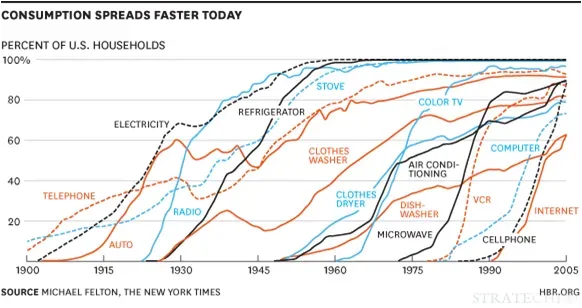
Now, let's look at the real adoption curve of historical technologies to understand how these phases played out in practice.
Origin:
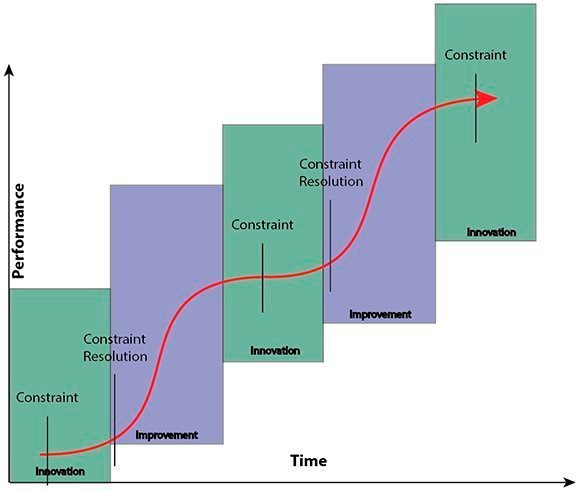
The S-curve is a universal phenomenon, found in numerous systems characterized by both positive feedback loops and constraints. It's a dance between two forces:
Positive Feedback Loop: This drives acceleration in the curve. Imagine a snowball rolling down a hill, gathering speed and size. The momentum feeds on itself, speeding up the process until…
Constraints: These act like barriers or friction, slowing down the growth. It's the obstacles in the path of the snowball that hinder its progress, temporarily halting the acceleration.
The intriguing rhythm of the S-curve comes from this push and pull between acceleration and constraint. Break one constraint, and the positive feedback loop surges forward again, only to be reined in by the next constraint.
This intricate interplay creates the signature S-curve, an essential concept in understanding the growth dynamics of various phenomena, including climate tech adoption.
This stop-and-go pattern is expertly detailed and exemplified in the context of solar technology in the book "How Solar Energy got Cheap." The story of solar power’s evolution perfectly captures this dynamic interplay, where technological advancements and decreasing costs led to spurts of growth, only to be halted by various constraints such as policy regulations, infrastructure limitations, or market acceptance.
For those yearning to explore the thrilling interplay of positive feedback loops and constraints further, "Invisible Asymptotes" is your next insightful read.
Categories of adopters
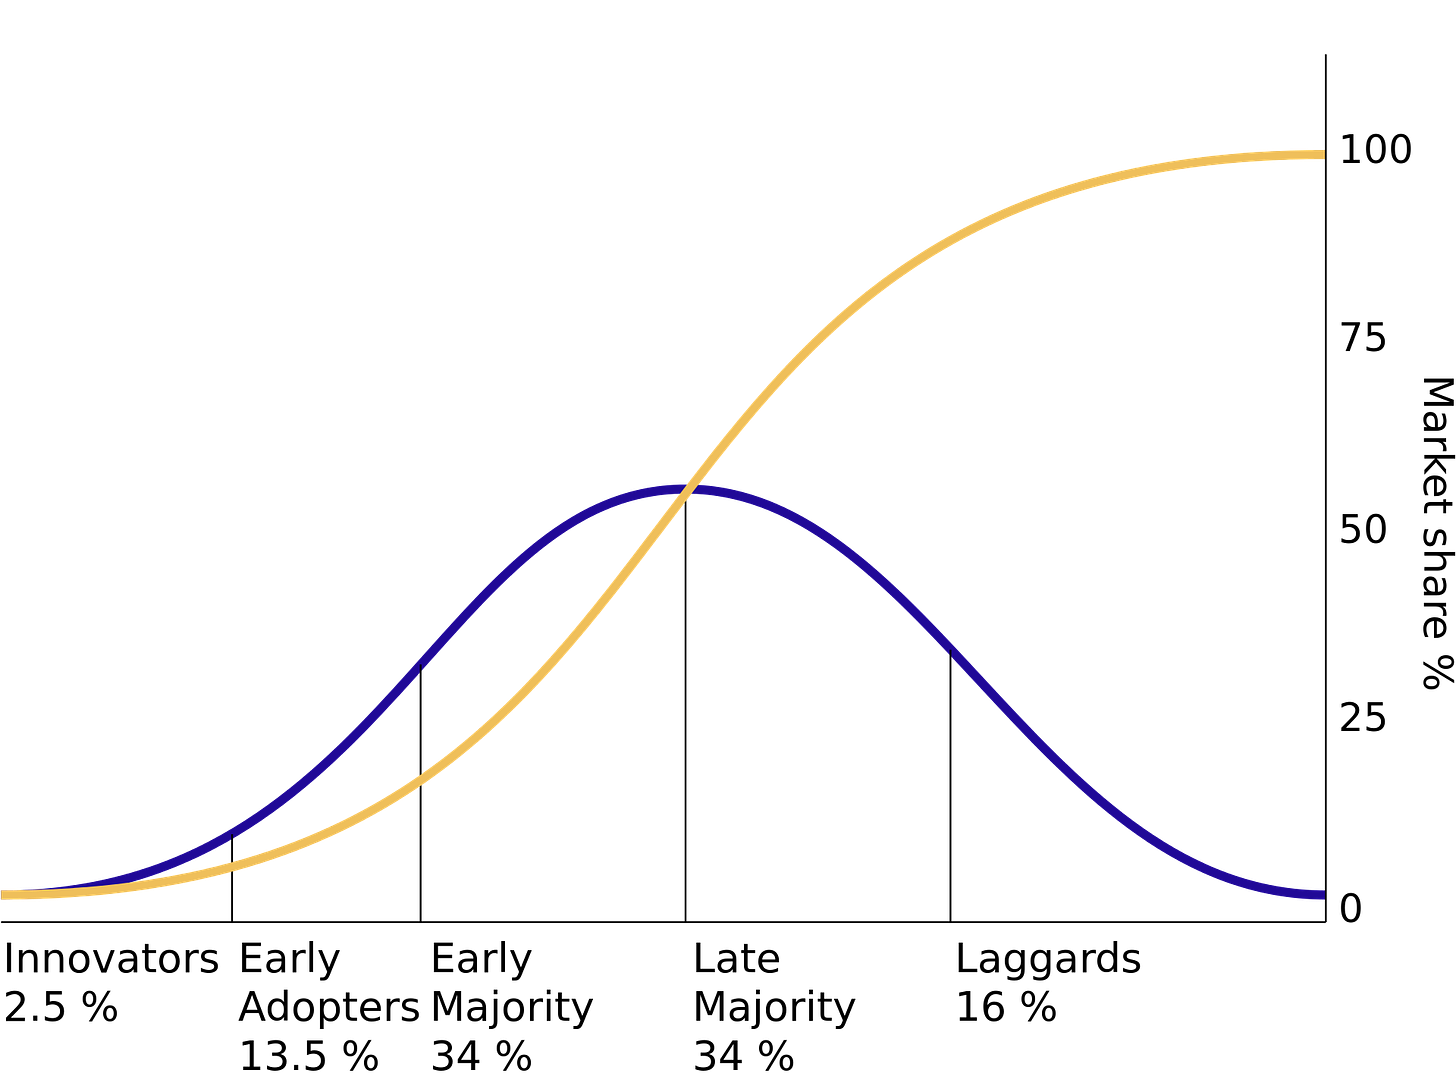
Adopters can encompass a wide array of entities, from individual enthusiasts to diverse organizations such as businesses, electricity providers, or governmental bodies. The spectrum of adopters can be broken down into the following key categories:
Innovators: These are the pioneers in adopting new technologies. They often possess the highest social status within their communities, along with substantial financial liquidity, and are highly connected to scientific resources. Innovators are typically characterized by their willingness to take risks, even embracing technologies that might ultimately fail, with their financial resources providing a buffer against such failures.
Early Adopters: Comprising the next 10%ish of the market, early adopters eagerly embrace the innovative product. Often referred to as “power users,” their insights significantly shape the development of the product, from the preliminary prototype to the finalized version.
Early Majority: Unlike the adventurous early adopters, the first majority, encompassing the subsequent 35%ish of the market, are less technically skilled and more cautious. They keenly observe the experiments of early adopters, and once the product reaches a stable evolution (crossing the chasm), they are prepared to adopt it.
Late Majority: This group is even more cautious than the first majority, holding off until there are clear indications of the product’s maturity and standardization before embracing the innovation.
Laggards: Typically resistant to change, laggards may oppose the innovation due to ideological concerns or fear. Alternatively, they might reject the offering in favor of a clearly inferior solution because of competition or sunk cost bias.
The product's growth kicks off when it gains traction with innovators and early adopters, leading to an accelerated adoption rate. As it begins to make inroads into the majorities, the growth curve steepens. Eventually, as market saturation is reached, the growth rate tapers off and ultimately aligns with the overall market's growth, drawing closer to an asymptotic limit
So now let’s put everything together and into a climate context:
Emergence: Slow Linear Growth
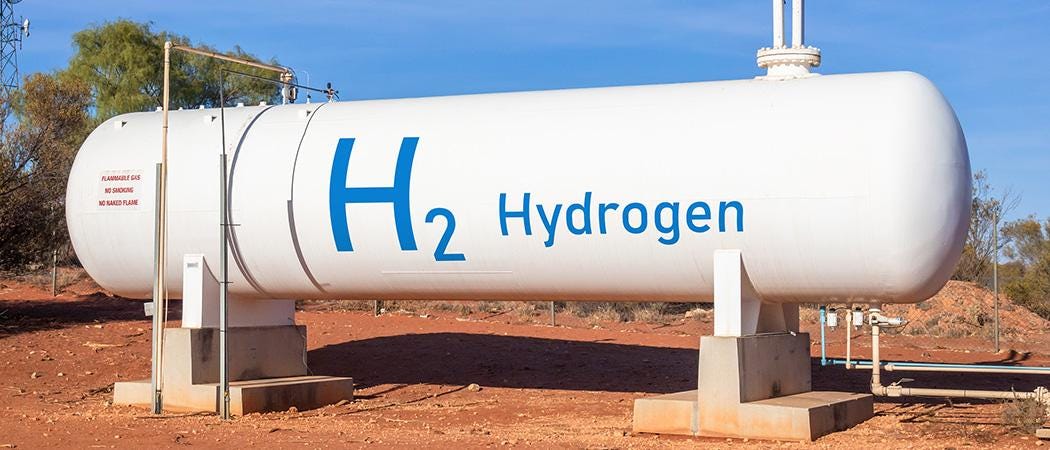
Example: Hydrogen Fuel Cell Technology
Why: Hydrogen fuel cell technology, particularly for vehicle use, is in its early stages of development with slow and steady growth. While fuel cells have significant potential to provide a clean source of power, there are several obstacles including the high cost of fuel cell production, the lack of a hydrogen distribution infrastructure, and the challenge of producing hydrogen in an environmentally friendly way. As a result, the technology's adoption has so far been limited and gradual, mostly by early adopters and certain niche sectors like public transportation in environmentally conscious cities.
Breakthrough: Exponential Growth
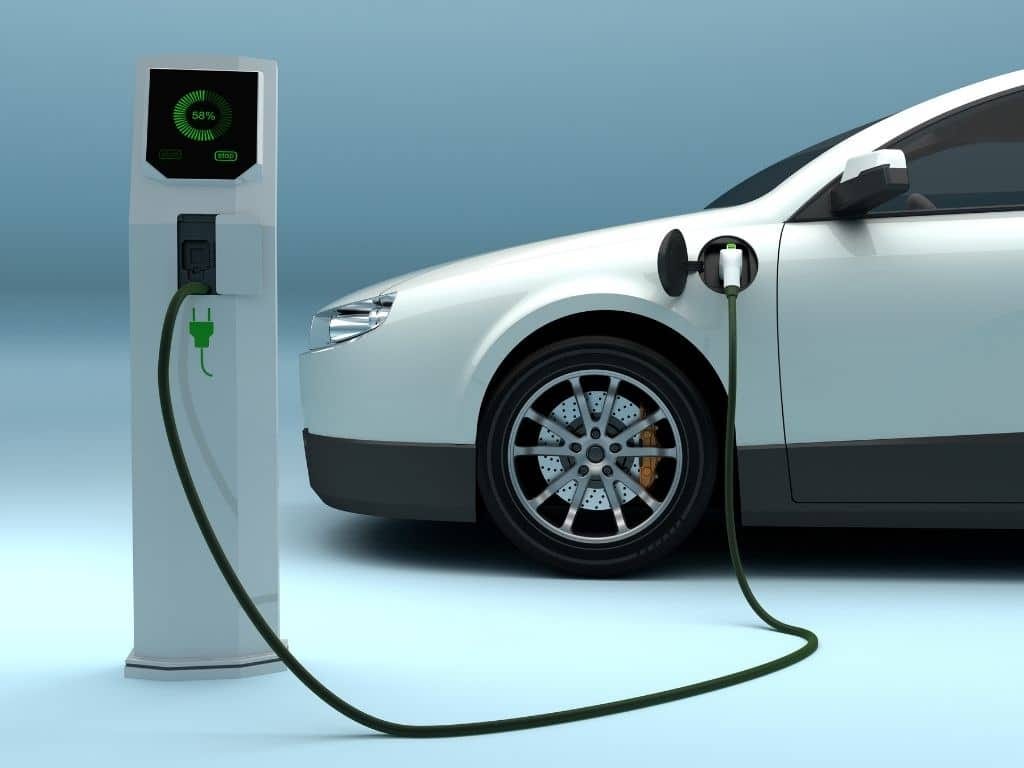
Example: Electric Vehicles (EVs)
Why: The breakthrough stage for EVs occurred when advancements in battery technology, increased charging infrastructure, and favorable government policies converged to make them more accessible and cost-effective. The decreasing cost of batteries, coupled with a growing societal push towards clean energy, has led to an exponential growth in EV adoption, marking a true tipping point in the transportation sector.
Diffusion: Fast Linear Growth
Example: Smart Thermostats
Why: The adoption of smart thermostats that allow users to control heating and cooling remotely has grown rapidly. Driven by consumer interest in energy savings and convenience, the market for these devices has expanded steadily, moving into the mainstream in many developed markets.
Reconfiguration: Declining Growth
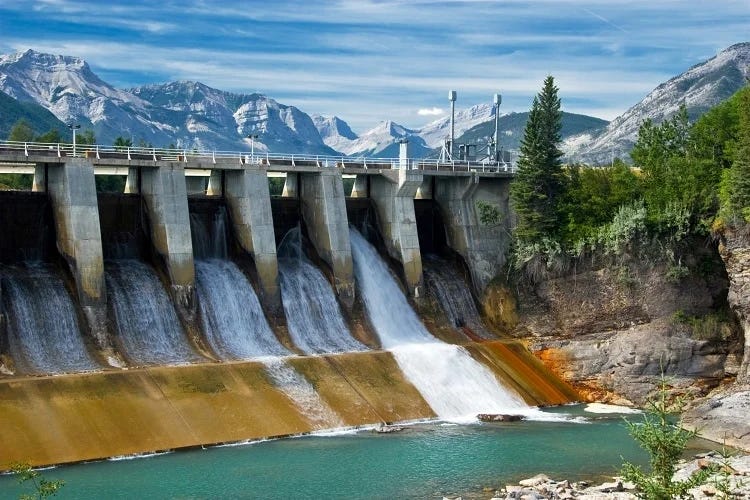
Example: Traditional Hydropower Dams
Why: Traditional hydropower dams, which have been a significant source of renewable energy, are now seeing declining growth in many regions. This decline can be attributed to environmental concerns, including the impact on aquatic ecosystems and the displacement of local communities. Additionally, the growth of alternative and more environmentally friendly renewable energy sources like wind and solar has led to a decreased emphasis on building new large-scale hydropower projects. The reconfiguration phase for traditional hydropower is characterized by a shift towards more sustainable practices, the exploration of smaller-scale hydro solutions, or even a reduction in new projects altogether.
Thank you for accompanying us on this journey through Climate Tech. In the fourth part of our series, we'll direct our attention to a phenomenon that's both fascinating and frequently misunderstood: the Hype Curve.
This isn't about sensationalism or fleeting trends. The Hype Curve represents a recurring pattern where technologies burst onto the scene, drawing attention and investment, only to later confront market complexities and challenges.
What appears to be a chaotic cycle is, in fact, a discernible pattern. The rise and fall, the enthusiasm and skepticism, are part of a rhythmic dance that underlies technological adoption.
In our next installment, we'll dissect the hype curves specific to various climate verticals, spanning Transportation, Agriculture, and Carbon Removal. It promises to be an insightful look into the mechanics of excitement, disillusionment, and realistic expectation-setting in the fast-evolving Climate Tech space.
Until then,
Skander
P.S.: Have a friend who's intrigued by the S Curve of technology adoption? Share this post with them and spread the knowledge.


